|
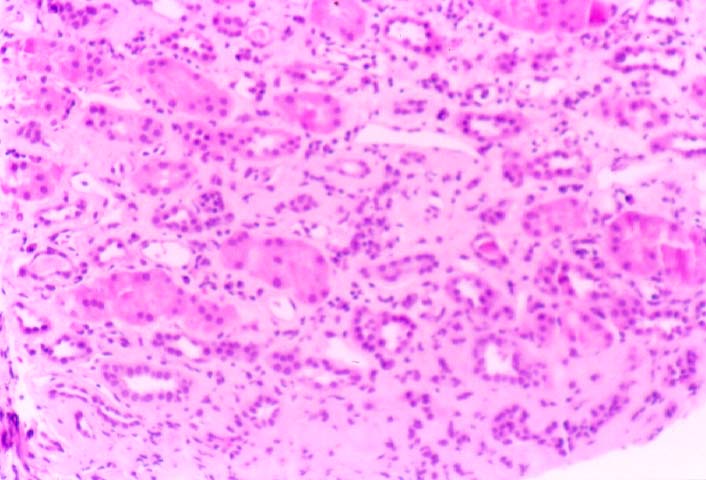
| Figure 3. Tubular atrophy can be recognized in this figure by the presence of tubules showing greater than 50% reduction in diameter compared to surrounding non-atrophic tubules. Atrophic change affects more than half of the sampled parenchyma (ct3). |